

Housing News
Affordability Alert: The 15 Housing Markets Where Home Prices Are Falling the Most
September 30, 2025
It’s no secret that it’s not an easy housing market to break into, especially for cash-strapped first-time homebuyers.
Home shoppers have been contending with prices that shot up during the pandemic, followed by rising mortgage rates. This double-whammy has sidelined many would-be homebuyers and trapped many existing homeowners who would prefer to trade up, down, or move to a new community.
However, the housing market has begun to shift. Prices are beginning to come down in many parts of the country, giving buyers a bit of a financial break.
These declines aren’t on the same scale as during the Great Recession, when home prices plunged. But those cheaper prices, combined with lower mortgage interest rates, could help many first-time buyers become first-time homeowners.
As is often the case, there are regional differences and some markets where prices are falling more than others.
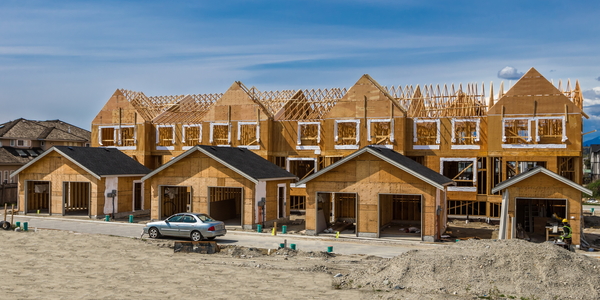
“In the South, there was lots of new construction during the pandemic, which led to more homes for sale,” said Hannah Jones, senior economic research analyst at Realtor.com. “As a result, homes are sitting for longer and prices are falling. Sellers, especially in these well-supplied Southern markets, are adjusting prices to meet buyers where they’re at.”
“Prices in West are adjusting to relatively low buyer demand because homebuying remains unaffordable for so many,” Jones said.
So, where are prices falling the most? To figure this out, we looked at the 150 largest metropolitan areas using August Realtor.com data. (Metros include the main city and surrounding towns and suburbs.)
The 15 housing markets with the steepest home price declines
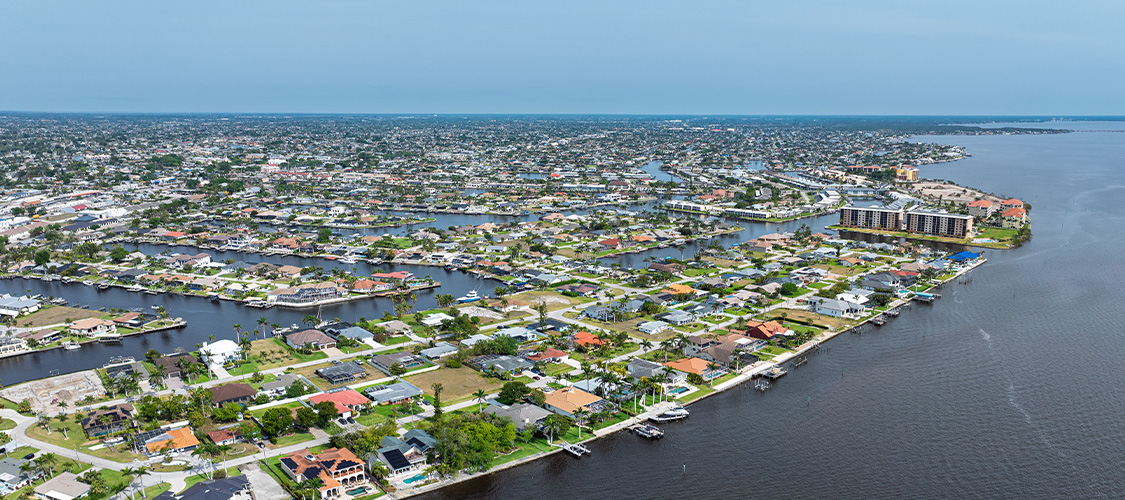
- Cape Coral, Fla.
Median home list price: $405,000
Price change year-over-year: -8%
Housing inventory change year-over-year: 20.6%
- Honolulu
Median home list price: $669,000
Price change year-over-year: -7.7%
Housing inventory change year-over-year: 23.1%
- Los Angeles
Median home list price: $1.1 million
Price change year-over-year: -7.6%
Housing inventory change year-over-year: 35.8%
- Durham, N.C.
Median home list price: $479,000
Price change year-over-year: -7%
Housing inventory change year-over-year: 52.4%
- Naples, Fla.
Median home list price: $699,000
Price change year-over-year: -6.8%
Housing inventory change year-over-year: 17.7%
- Gainesville, Fla.
Median home list price: $335,000
Price change year-over-year: -6.7%
Housing inventory change year-over-year: 23.4%
- Miami
Median home list price: $500,000
Price change year-over-year: -5.7%
Housing inventory change year-over-year: 24.3%
- Eugene, Ore.
Median home list price: $516,000
Price change year-over-year: -5.6%
Housing inventory change year-over-year: 15.6%
- Des Moines, Iowa
Median home list price: $350,000
Price change year-over-year: -5.4%
Housing inventory change year-over-year: 21.1%
- Santa Rosa, Calif.
Median home list price: $945,000
Price change year-over-year: -5%
Housing inventory change year-over-year: 32.1%
- Austin, Texas
Median home list price: $499,000
Price change year-over-year: -5%
Housing inventory change year-over-year: 15.4%
- San Diego
Median home list price: $950,000
Price change year-over-year: -4.9%
Housing inventory change year-over-year: 36.8%
- Oxnard, Calif.
Median home list price: $1 million
Price change year-over-year: -4.8%
Housing inventory change year-over-year: 48.3%
- Modesto, Calif.
Median home list price: $510,000
Price change year-over-year: -4.7%
Housing inventory change year-over-year: 35.5%
- Richmond, Va.
Median home list price: $429,500
Price change year-over-year: -4.6%
Housing inventory change year-over-year: 20.1%
Other notable metros with lower year-over-year prices included Boston, at -4.1%; Dallas, at -3.4%; Denver, at 3.2%; Phoenix, at 3.1%; Orlando, Fla., at -28%; and Chicago, at 2.6%.
Author


 Smart Moves Start Here.