Housing News
The 10 Hottest ZIP Codes of 2026
August 14, 2026
The hottest housing markets in America are not found in the Sun Belt or along the West Coast this year.
Instead, homebuyers are flocking to established suburbs in the Northeast and Midwest, according to Realtor.com’s 2026 Hottest ZIP Codes Report.
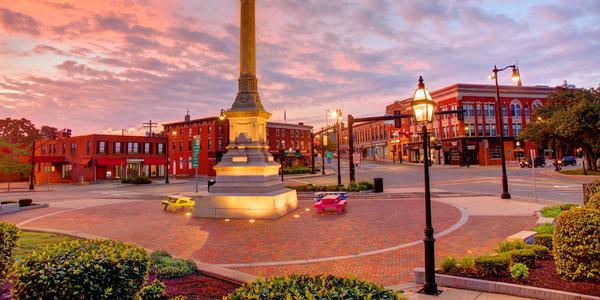
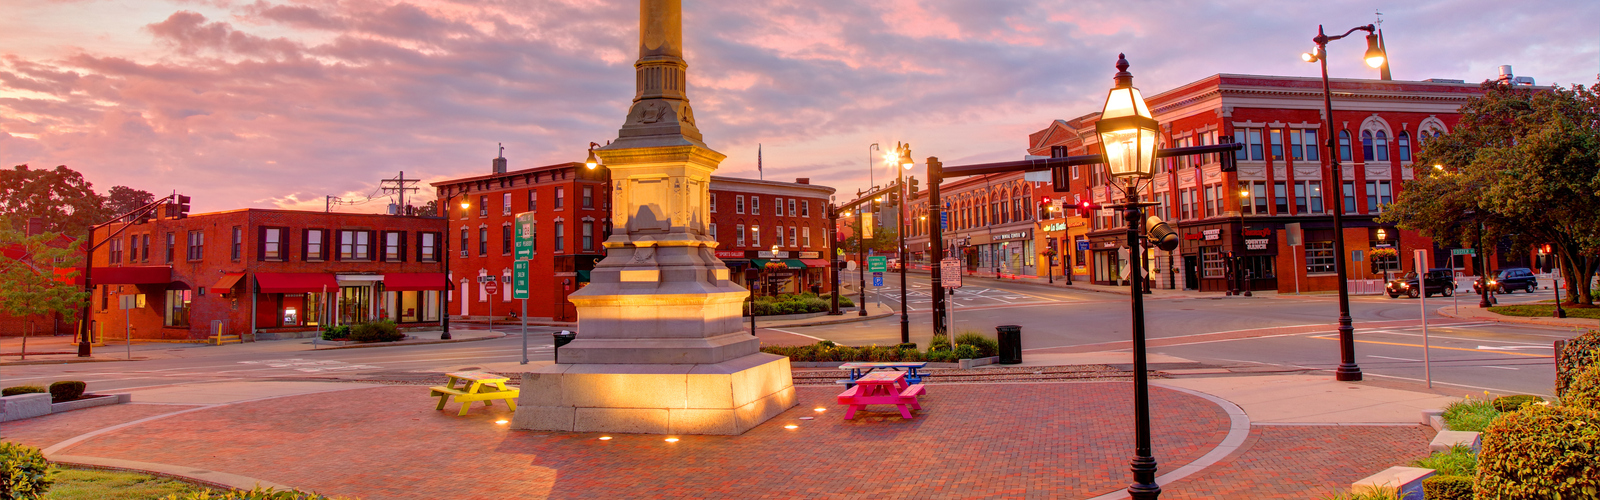
Peabody, Mass., topped the annual ranking. The North Shore suburb, located about 20 miles north of downtown Boston, last held the No. 1 position in 2018.
“Peabody offers a variety of neighborhoods, convenient highway access, plenty of shopping and dining, and good value compared with many nearby communities,” said local real estate agent Denise McCarthy. “Peabody also offers excellent value when it comes to property taxes and municipal services, including electric and water costs, making it very appealing for homeowners.”
Montclair, N.J., a New York City suburb known for its older homes and commuter access, ranked second. Sewell, N.J., outside Philadelphia, rounded out the top three.
“This year’s hottest ZIP Codes tell us that buyers aren’t simply chasing the lowest price tag anymore,” said Realtor.com Senior Economist Hannah Jones in a statement. “They’re chasing space, character, and a manageable commute to a major job center, and they’re willing to pay a premium to get it.”
For the fourth consecutive year, every ZIP Code in the top 10 was in the Northeast or Midwest.
Homes are selling faster in the hottest ZIP Codes
Homes in these sought-after ZIP Codes attracted three to 5.3 times more listing views than the national average during the first half of 2026, according to Realtor.com.
They also sold 30 to 42 days faster than the typical U.S. home.
Peabody homes spent a median of just 20 days on the market. About 70% of the ZIP’s listing views came from within the Boston metropolitan area, suggesting demand was driven largely by homebuyers already living nearby. (Metros include the main city and surrounding towns, suburbs, and smaller urban areas.)
Three ZIP Codes appeared on the list for the first time: Lititz, Pa.; North Haven, Conn.; and New Berlin, Wis.
The new additions show that homebuyer interest is spreading to smaller communities within the same Northeast and Midwest regions that have dominated the rankings in recent years.
Many homes sold for more than the asking price
Nationally, the typical home sold for about 2.3% below its asking price during the first half of 2026.
The experience was much different in the hottest ZIP Codes. Nine of the 10 markets recorded sale prices at or above asking, with homes selling for an average of about 3.8% more than their listing prices.
Montclair recorded the largest premium. Homes there sold for an average of 16.7% above asking.
Homes in Fairport, N.Y., a suburb of upstate Rochester, N.Y., sold for an average of 14.4% over asking.
Those premiums may indicate multiple-offer situations. Homebuyers interested in one of these competitive ZIP Codes may benefit from establishing a firm budget before submitting an offer.
Homebuyers are paying more for additional space
Nine of the 10 hottest ZIP Codes had higher home prices than their surrounding metropolitan areas. Eight had homes that were larger than the typical property listed in the broader metro.
Across the 10 ZIP Codes, the median home for sale measured 2,000 square feet. That compared with 1,600 square feet in the surrounding metros and 1,800 square feet nationally.
Montclair stood out for size. Its homes for sale averaged 2,625 square feet, about 86% larger than the New York metropolitan-area norm.
The communities also tend to be located about 10 to 20 miles from their metro’s central business district. The distance can provide more living space while preserving a manageable commute.
The hottest ZIP Codes have limited housing stock
The number of homes for sale remained below pre-pandemic levels in the most competitive ZIP Codes.
Nationally, the housing stock was 11.3% below typical pre-pandemic levels in June. In the 10 hottest ZIP Codes, the shortfall was 60.5%.
Relatively limited home construction in the Northeast and Midwest has contributed to greater competition. More robust construction and softer home price growth in parts of the South and West have helped give homebuyers more choices in those regions.
“If you are looking to buy in Peabody, make sure to get fully pre-approved [for a mortgage,] explore the different areas of the city, and be ready to act when the right home becomes available,” said McCarthy. “Go and see a home even if you think a home is overpriced. If it gets a price reduction, you will already have seen it and can act fast with your offer.”
Homebuyers arrived with strong financial profiles
Homebuyers in the hottest ZIP Codes made an average down payment of 17.1%, compared with about 13.1% nationally.
Their median credit score was 766, compared with the national median of about 747.
Montclair homebuyers made an average down payment of 22.1%, or more than $318,000, and had a median credit score of 783.
Peabody’s homebuyer profile was closer to national norms. Homebuyers there made an average down payment of 14% and had a median credit score of 747.
The 10 hottest ZIP codes of 2026
- Peabody, Mass. 01960
Median listing price: $600,000 - Montclair, N.J. 07042
Median listing price: $1.05 million - Sewell, N.J. 08080
Median listing price: $426,000 - Fairport, N.Y. 14450
Median listing price: $429,000 - Westfield, Mass. 01085
Median listing price: $381,000 - Livonia, Mich. 48154
Median listing price: $338,000 - Lititz, Pa. 17543
Median listing price: $598,000 - North Haven, Conn. 06473
Median listing price: $562,000 - New Berlin, Wis. 53151
Median listing price: $445,000 - Wheaton, Ill. 60187
Median listing price: $575,000
Author

 Stay one step ahead